New Delhi: Scientists may soon be able to study the future magnetic activity of the sun with the understanding of its behaviour in the past. A magnetic field map corresponding to the first half of the last century has been developed recently that can immensely improve that understanding.
Just like in case of climate studies, astronomers need the information on the behaviour of the Sun in the past to predict how it will behave in the future. A critical parameter of the behaviour is the magnetic field which keeps varying and governs the long-time changes in the Sun.
Technology today has enabled direct observations of the magnetic field, but there are no direct observations of magnetic field recorded before the 1960s.
Recently, Indian researchers have digitised the films and photographs of the sun taken at multiple wavelengths and corresponding to the past century as recorded from the Kodaikanal Solar Observatory (KoSO) of Indian Institute of Astrophysics (IIA).
Scientists from the Aryabhatta Research Institute of Observational Sciences (ARIES) used this digitised data which they called the proxy data to develop the first magnetic field map of the Sun for the period 1915-1965.
(Photo: www.pib.gov.in)
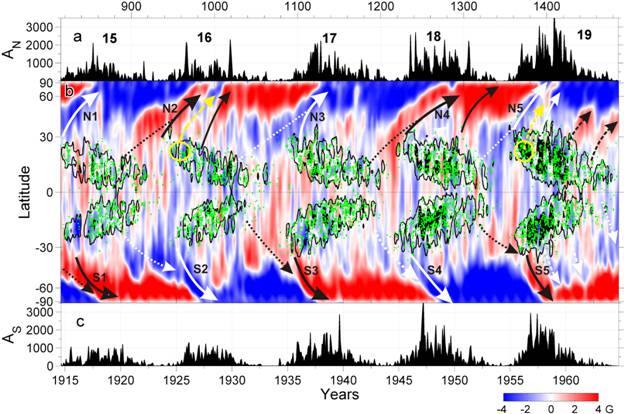
Image caption: (a) Variation of the sunspot areas in the northern/southern hemisphere. (b) Zonally averaged magnetic field is shown in blue-to-red. Zones of intense sunspot activity, domains of negative tilt predominance are shown in black and green, respectively. Numbers of solar cycles are labelled at the top panel. The remnant flux surges of following/leading polarities are shown by solid/dashed arrows. Critical surges are shown with bold arrows and labelled as N1/S1, N2/S2, N3/S3, N4/S4, and N5/S5 for Cycles 15–19. The yellow ovals show possible sources of the (opposite) leading-polarity surges.
The map of this period corresponding to the solar cycles 15 -19 will help understand the magnetic variability and predict changes in the Sun in the future.
The research is led by Director ARIES, Prof Dipankar Banerjee and his team including Dr Bidya Karak from IIT (BHU), a Ramanujan Fellow of DST, and supported by DST and Russian Foundation for Basic Research project through an Indo-Russian Joint Research Program was published in the ‘Astrophysical Journal Letters’ recently.
According to Dr Banerjee, the digital data from KoSO is unique because this is the only observatory in the globe which provides the long-term uniform observations of the Sun in terms of the location and strength of its magnetic field as well as polarity through Ca II K and H alpha lines for more than a century.
More than 15,000 digitised images of the Sun has helped develop the magnetic field map of the period.
The map will also help study with a precision polar reversal, a unique feature of the Sun, which occurs every 11 years and shows a distinct pattern that repeats over time.